
The medical information below has been compiled from various sources by Dr. Anoop Prathapan. First posted on the 2nd of December 2021. This is not an originally scripted article. This page will be updated regularly with more information.
PART I
Reading an ECG
What is depolarisation and repolarisation?
Depolarisation is the initial spread of stimulus through muscle, causing contraction.
Repolarization is the return of stimulated muscle to the resting state.
Normal ECG
P wave, QRS, ST-segment and T wave
P - produced by atrial depolarisation
QRS - produced by ventricular depolarisation
ST-Segment - the distance from the end of the QRS complex to the beginning of the T wave. It stands for the start of ventricular repolarisation.
T - ventricular repolarisation
J point - the point on the ECG complex that demarcates the QRS from the ST segment.
J wave - also called Osborn wave - is a positive deflection before the J point - seen in hypothermia (see images below)
U - not always seen. When it is seen, it is after the T wave before the subsequent P. It stands for interventricular septum repolarisation or slow repolarisation of the ventricles.
Atrial repolarisation is light and is embedded in the QRS - there is no separate wave on the ECG for atrial repolarization.


a - normal J point, b and c - J point elevation, d - J point depression, e - Osborn wave
ECG Interpretation
Start by verifying the patient details to see if you are examining the ECG of the correct patient. Then check the date and time; the ECG was recorded. Check the calibration of the ECG. (usually 25mm/s or 1500mm/min)
Heart Rate
The average Adult Heart Rate is 60-100 beats per minute
Tachycardia is when the rate greater than 100 per minute
Bradycardia is when the rate is less than 60 per minute
Regular Heart Rhythm
If a patient has a regular heart rhythm, their heart rate can be calculated using the following method
Count the number of large squares present within one R-R interval.
Divide 300 by this number to get the heart rate.
For example - if there are four large squares in an RR, the heart rate is 300/4 = 75 per minute.

Irregular Heart Rate
If the heart rate is irregular, the above method does not work as the RR intervals would be irregular. In such cases, count the number of QRS complexes in a 6-second strip - means - 30 large squares and multiply it by 10. So, for, e.g., if there are 12 of those, the rate is 12x10 = 120/minute.

Heart Rhythm
Can be regular, regularly irregular (the irregularity follows a pattern) or irregularly irregular (total on the ECG)
If there is a suspicion that there is some atrioventricular block (AV block), map out the atrial rate and the ventricular rhythm separately (i.e. mark the P waves and R waves). As you move along the rhythm strip, you can see if the PR interval changes, if QRS complexes are missing or if there is complete dissociation between the two.
Cardiac Axis
The cardiac axis describes the overall direction of electrical spread within the heart.
The axis should spread from 11 o’clock to 5 o’clock in a healthy individual. More scientifically, it is the sum of all depolarization waves as they spread through the ventricles.
Axis can be determined by checking the amplitude of the QRS in Leads I, II and III. The most significant amplitude of the R wave in either of these leads indicates the proximity of the cardiac axis to that lead. The axis lies at 90 degrees to the isoelectric complex.
Way to determine the cardiac axis
Positive QRS in Leads I and II - axis is normal
Left Axis deviation - Positive QRS in Lead I and negative in Lead II (-30 to -90 degrees)
Right Axis deviation - Negative QRS in lead I and Positive in Lead II (90 to 180 degrees)
Intermediate Axis - when the QRS lies between 180 and -90 degrees.
Positive QRS in Leads I and II - axis is normal

Positive QRS in Lead I and negative in Lead II - Left Axis deviation (-30 to -90 degrees)

Negative QRS in lead I and Positive in Lead II - Right Axis deviation (90 to 180 degrees)

Cardiac Axis - an overview

P waves (2.5 small squares)
P waves are formed by the spread of electrical activity through the atria.
Best interpreted in lead II as atrial depolarization is more towards Lead II and in V1 since the impulses spread from Right to Left Atrium.
Normal P is rounded - not peaked or notched
Check the following:-
1. Are P waves present?
2. If so, is each P wave followed by a QRS complex?
3. Do the P waves look normal? – check duration, direction and shape
4. If P waves are absent, is there any atrial activity?

P wave is absent due to
Atrial Fibrillation
Atrial Flutter (saw-tooth appearance)
SA Block or sinus arrest
Ventricular ectopic and ventricular tachycardia
SVT (P is hidden in the QRS)
Hyperkalemia
P wave is tall (P-Pulmonale) due to
atrial hypertrophy or enlargement
P wave is small due to
Atrial tachycardia
Atrial ectopics
Nodal rhythms
P wave is wide due to
Mitral Stenosis - P-Mitrale - notched and broad - due to left atrial hypertrophy and enlargement. In V1, P wave may be biphasic with a slight positive and a substantial negative deflection.
P wave is inverted due to
incorrectly placed leads
dextrocardia
nodal rhythm with retrograde conduction
Low atrial and high nodal ectopic beats
There are multiple P waves due to
A-V Block (partial or complete)
SVT with AV Block
P-R interval
The usual interval is 120-200ms (3-5 large squares)
Any delay indicates a block
PR interval is short if it is less than 0.10 sec and long if it is more than 0.22 sec.
First Degree Heart Block
Has fixed prolonged P-R intervals >200ms
Ischemic Heart Disease
Acute Rheumatic carditis
Atrial Dilatation or Hypertrophy
Hypokalemia
Drugs like Digitalis, Quinidine, Beta Blockers, Calcium Channel Blockers
Short P R interval <120ms
Simply, the P wave originates from somewhere closer to the AV node making the conduction take lesser time (the SA node is not in a fixed place, and some p, people's atria are smaller than others).
The atrial impulse gets to the ventricle by a faster shortcut than conducting slowly across the atrial wall. This is an accessory pathway and can be associated with a delta wave (see below, which demonstrates an ECG of a patient with Wolff Parkinson White syndrome).
The Delta wave is a slurred upstroke in the QRS complex often associated with a short PR interval.
Wolff Parkison White (WPW) Syndrome - featuring a delta wave
Lown Ganong Lewine (LGL) Syndrome - featuring no delta wave

Variable P-R Interval
Second-degree heart block type 1 - Mobitz Type 1 - progressive lengthening of the PR interval followed by a dropped beat.
Second-degree heart block type 2 - Mobitz Type 2 - Partial heart block - PR interval is fixed and normal - but sometimes P is not followed by QRS - due to failure of conduction. The complex is dropped after the third P (3:1 block) or the 4th P (4:1 block)
Third Degree Heart Block - occurs when there is absolutely no electrical communication between the atria and the ventricles due to complete failure of conduction.


this is a third-degree heart block
There is an interesting (mnemonic) story to memorise this:-

Q Wave
Q wave is usually absent in most of the leads. But when present, it indicates septal depolarisation.
Small Q may be present in Lead III, which disappears with inspiration.
Pathological Q wave is
Deep, >2mm
Wide, >0.04sec
should be present in more than one lead
associated with the loss of height of the immediate R wave
it should be more than 25% of the immediate R wave of the same lead.
Causes of Pathological Q wave
MI
Left or Right Ventricular Hypertrophy
Cardiomyopathy
Left Bundle Branch Block (LBBB)
Emphysema
Please Note
Q wave in V1, V2, V3 might be seen in LVH and should not be mistaken for MI
Abnormal Q wave in lead III is found in pulmonary embolism
Abnormal Q wave in Lead III and aVF may be seen in WPW (not to be confused with old inferior wall MI)
R Wave (<0.01 sec)
The first positive deflection due to ventricular depolarisation.
R wave increases in height from V1 to V6 - V1 being the shortest (<1mm) and upto 25mm in V6.
R wave height more than 25mm is pathological.
Causes of tall R wave in V5 or V6 - LVH (in V5 or V6 >25mm, aVL >13mm, aVF > 20mm)
Causes of tall R wave in V1
RVH
true posterior wall MI
WPW syndrome
RBBB
Dextrocardia
Causes of small R wave
Obesity
Emphysema
Pericardial Effusion
Hypothyroidism
Hypothermia
Causes of poor progression of R wave
Anterior or Anteroseptal MI
LVH
Dextrocardia
COPD
Pneumothorax (left side)
Left-sided massive pleural effusion
deformities of the chest wall
S wave
The negative deflection after the R wave
Follows a reverse pattern to R wave - decreases in height from V1-V6.
In V3, R and S are almost equal.
QRS Complex (0.8-0.11 secs, <25mm)
Depolarization of ventricular muscles
QRS is positive in leads that look at the heart from the left side - lead I. avL, V5 and V6
QRS is negative in leads that look at the heart from the right side - aVR, V1, V2
QRS appears biphasic in v5 and V6

Types of QRS

Abnormalities of QRS complex
Causes of High Voltage QRS
Thin chest wall
Ventricular Hypertrophy (L or R)
WPW Syndrome
Posterior wall MI (V1 and V2)

this is an ECG of LVH showing huge QRS complexes
Causes of Low Voltage QRS
Thick chest wall or obesity
Hypothyroidism
Pericardial effusion
emphysema
chronic constrictive pericarditis
hypothermia

Causes of wide QRS
Bundle Branch Block
Ventricular ectopics
Ventricular tachycardia
Ventricular hypertrophy
Hyperkalemia
WPW Syndrome
Drugs like quinidine, phenothiazine, TCA

ST-Segment
In a healthy normal individual, it should be an isoelectric line - neither raised - nor depressed. A rise of 1mm in the limb leads and 2mm in the chest leads can be considered normal.
Elevated ST
Acute MI
Acute pericarditis
Prinz metal's angina (ST-elevation with Tall T)
Ventricular aneurysm (persistent ST elevation)
Early repolarisation
Hyperkalemia (rare)

Depressed ST
Acute myocardial ischemia. (horizontal or downslope ST depression)
ventricular hypertrophy with strain
Digoxin toxicity
Acute true posterior MI

ST-elevation with associated J point elevation is seen in early repolarisation, which should not be confused with acute MI or pericarditis. Detailed history, serial ECGs (which shows no new change) and comparison with old ECG is helpful.
T wave (>2mm)
Ventricular repolarisation
upright in all leads except aVR
typically inverted in V1 and V2
T wave inversion in
MI or ischemia
Ventricular ectopic
Ventricular hypertrophy with strain
Acute pericarditis
Cardiomyopathy
Myxedema
Bundle branch block
Drugs like digitalis, emetine, phenothiazine
Physiological conditions like smoking, anxiety, anorexia, exercise et .c)
Tall T wave in
Hyperkalemia (ECG below)
Hyperacute MI

Small T wave in
Hypokalemia
Hypothyroidism
Pericardial effusion
U wave (1mm)
seen after T wave
slow repolarisation of the interventricular septum
better seen in the chest leads V1 to V6
An inverted U wave is seen in
Ischemic heart disease
LVH with strain
A prominent U wave is seen in
Hypokalemia
Bradycardia
Ventricular Hypertrophy
Hyperthyroidism
Hypercalcemia
Drugs like phenothiazine, quinidine, digitalis.

PART II
SPECIFIC CASES
Left Ventricular Hypertrophy
The left ventricle hypertrophies in response to pressure overload secondary to conditions such as aortic stenosis and hypertension
Voltage criteria
Sokolov-Lyon criteria - S in V1 + R in V5 or V6 >35mm (applicable only to those above 25 years of age)
other criteria
Limb Leads
R wave in lead I + S wave in lead III > 25 mm
R wave in aVL > 11 mm
R wave in aVF > 20 mm
S wave in aVR > 14 mm
Precordial Leads
R wave in V4, V5 or V6 > 26 mm
R wave in V5 or V6 plus S wave in V1 > 35 mm
Largest R wave plus largest S wave in precordial leads > 45 mm
Non-Voltage criteria
Increased R wave peak time >50ms in V5 or V6
ST-segment depression and T wave inversion in the left-sided leads (Lead I, aVL, V4 to V6): aka, the left ventricular ‘strain’ pattern.
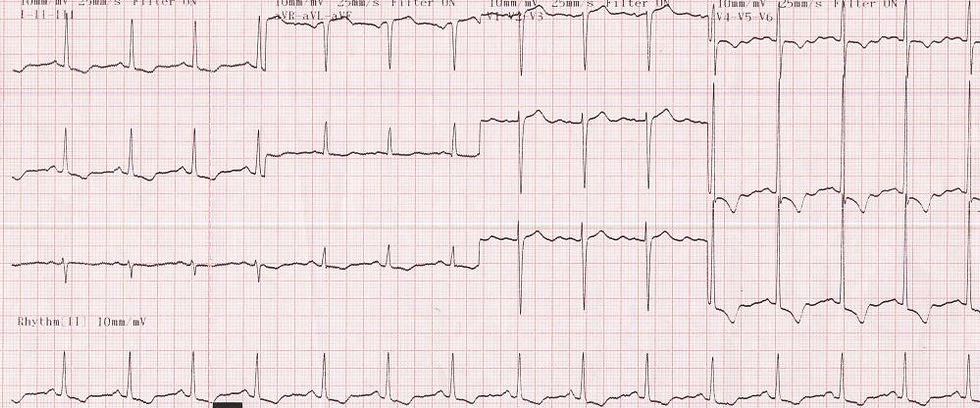
LVH with strain pattern
Right Ventricular Hypertrophy
ECG criteria of RVH
Tall R wave in V1> 7mm (also, maybe, deep S in V5 or V6)
ECG criteria for RVH with strain
Tall R wave in V1> 7mm (also, maybe, deep S in V5 or V6)
PLUS
ST depression and T inversion in V1 and V2

Atrial Fibrillation
ECG criteria
P wave absent and might be replaced with the fibrillary f wave
Rhythm is irregularly irregular
AF is fast is rate >100 and slow if rate <100
Atrial rate is very high compared to the ventricular rate

Ashman Phenomenon
is a type of aberrant ventricular conduction that occurs during AF when a long RR is followed by a short RR
ECG shows AF followed by supra ventricular impulse resulting in wide QRS - or to put it simply - it is wide QRS in between AF

Myocardial Infarction
Need to look for ST elevation (due to myocardial injury), Q waves (due to myocardial necrosis) and T inversion (due to ishchemia).
A fully evolved MI will have
ST elevation
pathological Q wave
T inversion
Sites of MI as detected from the various leads
Inferior - Lead III and aVF (and Lead II as well)
extensive anterior MI - V1 to V6
anteroseptal MI - V1 to V3 or maximum V4
Lateral MI - Lead I, aVL, V5 and V6
posterior true MI - V1 and V2 (maximum V1 to V4)
subendocardial MI - symmetrical T inversion in all chest leads
high lateral MI - Lead I and aVL
anterolateral MI - Lead I, aVL, V1 to V6
Right ventricular MI - V3R and V4R

inferior wall MI

anterior wall MI

posterior wall MI
ST-elevation persisting a few months after an MI can be due to Ventricular aneurysm which can be diagnosed with a proper history, double apex beat (see-saw movement), enlarged heart, and confirmed by an ECHO.
Treatment of MI shall be dealt with on a separate page.
Right Bundle Branch Block
QRS - Wide> 0.12 sec (3 small squares)
RSR' in V1 and V2 (M pattern)
broad and deep S in V5 and V6 (maybe also in L1 and aVL)

Left Bundle Branch Block
RSR' in V5 and V6
QRS wide > 3 squares in all leads (clue to diagnosis)

This page will be updated with more conditions, regularly. So please keep coming back. If anyone feels any other heading needs to be included, kindly drop me a mail to anoop.prathapan@gmail.com and we will work on it, for sure. Alternatively, if you wish to drop your comments under this article, please sign up/subscribe to this page, por favor...!!! Gracias....!!!
©2021, anoopprathapan
Instagram, Facebook – Anoop Prathapan
Comments